What is a flow operation?
In Chioro, a flow operation (or simply operation) is an element of a flow. An operation receives records from its predecessor operation(s), processes them, and sends the processed data to its successor operation(s). Predecessors or successors result from the connections (arrows) in the graphical flow editor. Only data sources or data destinations naturally have no predecessors or successors.
There are operations to import or export data (data source and data destination), to modify records (Transformation), to join records from others (Join), to call external services (Call), to control the data flow (Gate) and some more.
Create an operation
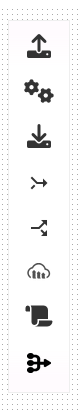
A new operation is created by dragging it into the flow from the toolbox on the left in the graphical flow editor.
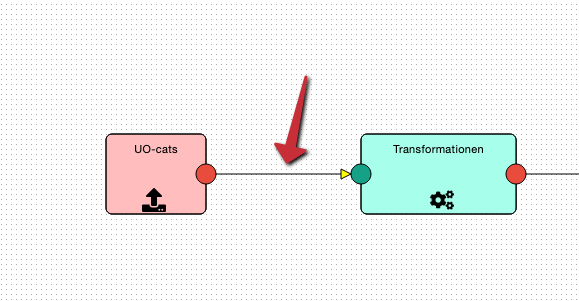
To actually be used in the flow, it must then be connected to its predecessors and successors using appropriate arrows:
Delete an operation
An operation can be removed from the system in two different ways. Caution! A deleted operation cannot be restored! For this reason, a confirmation prompt is issued before deletion.
Note: By deleting an operation, the predecessor and successor operations remain orphaned and must be reconnected.
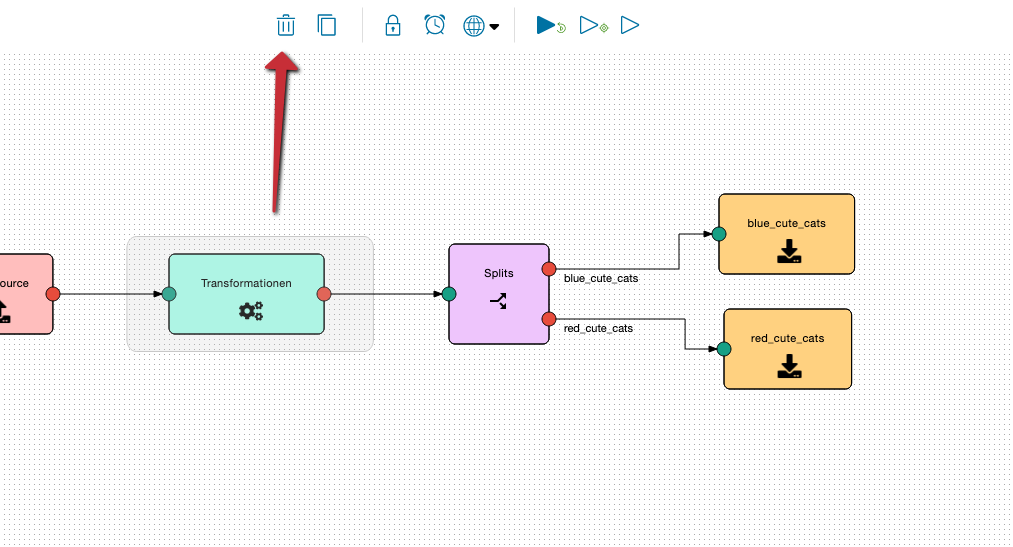
Deletion in the graphical flow editor
In the graphical flow editor first select (highlight) the operation and then delete it by clicking on the trash icon.
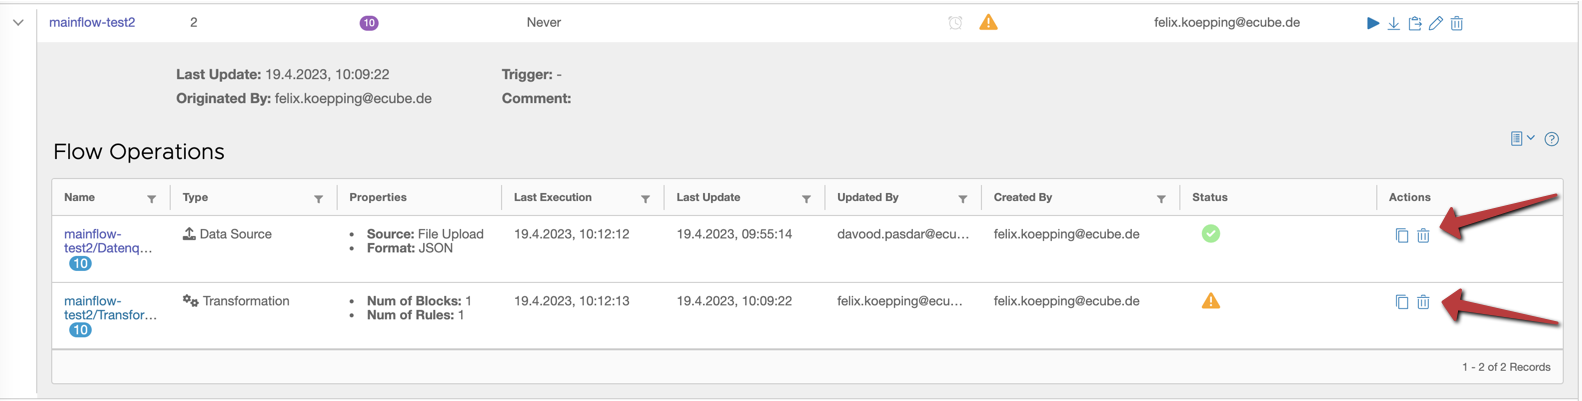
Alternatively you can delete an operation in the tabular flow overview by clicking on the trash icon:
Configure an operation
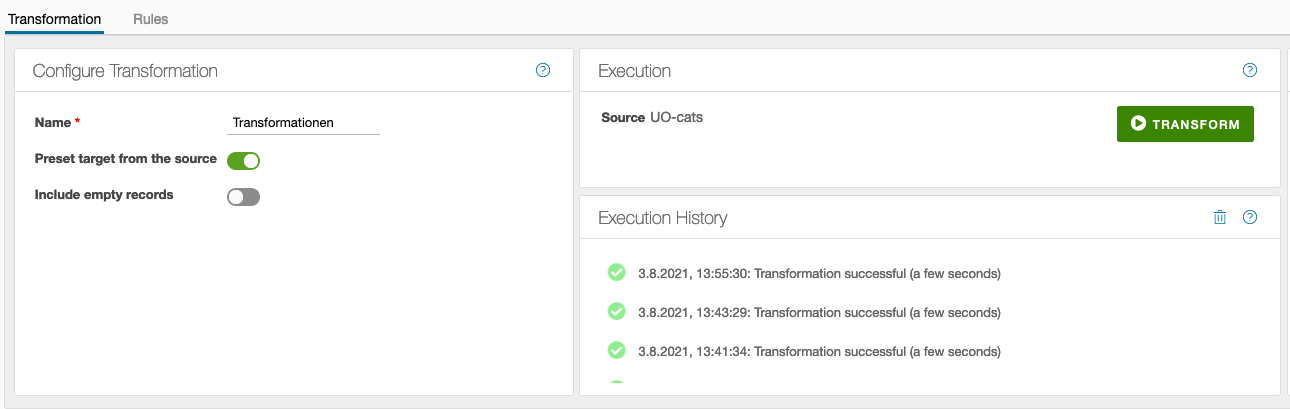
A flow operation is configured in the Operation Editor, which is located directly below the graphical flow editor.
For many types of operations, this area includes several levels, which can be selected via tabs at the top. The content of the layers depends strongly on the type of operation. However, the first level is more or less the same for all of them:
- On the left there are some basic settings of the operation.
- In the middle is the button to execute the operation and below that the history of executions.
- On the right there are some informative metrics about the data generated by the operation.
The content of the other levels - selectable by tab - depends, as said, on the type of operation. Mostly, however, the detailed configuration of the operation can be found here, e.g. the definition of the transformation rules.
All operations have in common that they have a name. This should be meaningful and sufficiently unambiguous (both is however not compelling).
Execute an operation
A special feature of Chioro is that each operation can be executed on its own. This has the great advantage that - in connection with Chioro’s preview feature - it is possible to work iteratively on an operation without having to execute all preceding operations each time.
A prerequisite for an operation to be executed is, of course, that the data of the predecessor operations are available. For this the predecessor operations must have been executed at least once.
A single operation is started in the first tab of the Operation Editor. There you can find basic information about the operation, like execution history and result metrics (see below).
If an execution was faulty, it will be marked accordingly in the history. The detailed problem descriptions can be found in the Journal, which is located in the Data Evaluation (description there).
Incorrect Flow Operationen
If an operation has an incorrect status after execution, this is indicated in the Flow Editor at the individual operations in the top right corner.
![]()
![]()
![]()
-
 The Action was incorrect
 -
 The Action was partly incorrect
 -
 The Action was canceled
Metrics
Most operations create some metrics about the result during execution. These are displayed on the far right of the Operations Editor. Here for example for a data source:
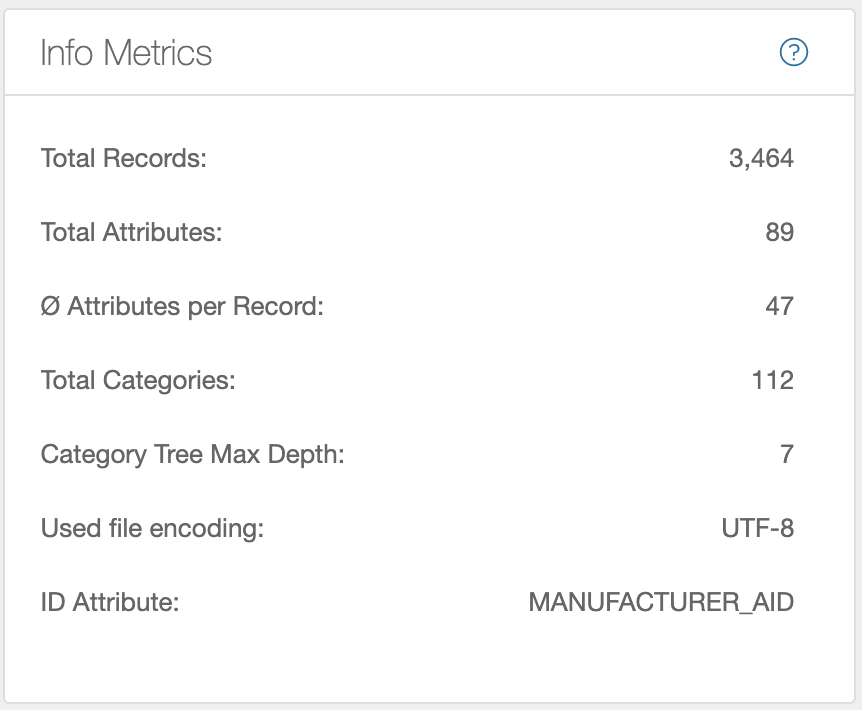
- Total number of records
- Total number of attributes
- Average records per attribute
- Category tree properties: if imported data contains a category tree, the “number of categories” and the “maximum depth” of the tree are listed.
- The file encoding with which the file was read. Helpful as feedback if automatic file encodig detection was selected when importing a data source.
- Existing ID attribute to identify the records.
- DQI (Data Quality Index): A heuristic 0–100 quality score for operations whose result can be checked against a target schema (for example Attribute Extraction). Only displayed when the operation has computed a DQI (see section below).
DQI – Data Quality Index
The DQI is a structural quality score that helps you compare different runs of an operation — for example after changing the prompt, the model, or the target schema. It does not judge whether the extracted values are semantically correct, only how well they fit the configured target schema.
For each target attribute, two figures are combined:
- Fill rate — the share of records in which the attribute has a non-empty value.
- Conformity rate — the share of filled values that satisfy the schema constraints. Currently the value list of an attribute is checked (if one is configured). If an attribute has no constraint, conformity is treated as 1.0.
Per attribute:
dqi_attribute = fill_rate × conformity_rate
The overall score is the weighted average across all schema attributes, scaled to 0–100. Certain attributes are weighted twice as heavily (factor 2 instead of 1):
- Attributes that are marked as mandatory in the schema. If they remain empty, this affects the DQI doubly.
- Attributes with a value list, when the operation has the option “Filter result to schema attributes” enabled. Values outside the list should not appear in this mode at all — when they do, they count double.
If both rules apply to the same attribute, the weight stays at 2 (it does not stack further).
What the DQI does not do
- It does not assess the semantic correctness of a value. An AI model that consistently produces plausible but wrong values from a misleading prompt can still achieve a high DQI.
- It does not replace spot-checking. Treat it as a complementary signal — a DQI increase after a prompt change indicates that the change improved something structurally, not proof that the data is semantically better.
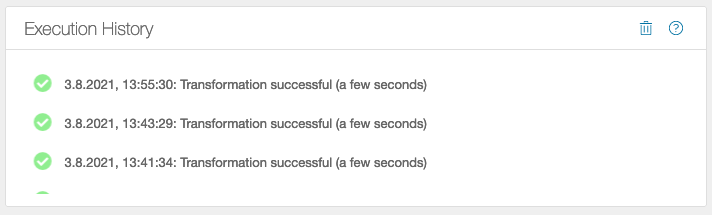
History
Each operation keeps a history of its last executions:
-
. The operation was successful
 -
. The action is running at the moment
 -
 The action was aborted
The ![]() icon can be used to clear the history.
icon can be used to clear the history.
Data Exploration
As mentioned above, each operation in Chioro can be performed individually. This is made possible by the fact that the product data is cached on its way through the operations (by default) after each operation. This cached data is searchable and can also be visualized and analyzed.
For this purpose there is the Data Explorer which is located directly below the Operation Editor.
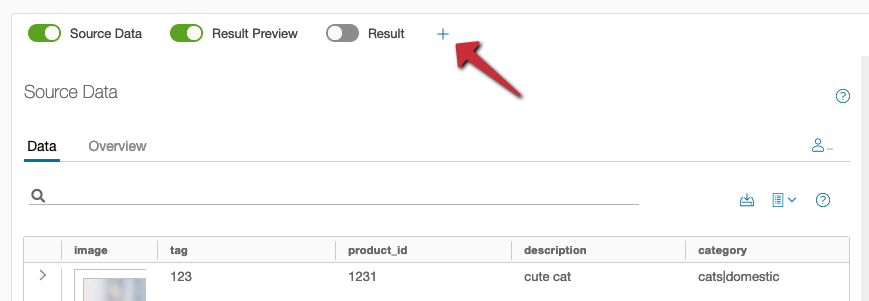
In the Data Explorer, different data tables can be displayed via buttons. Which ones depend a bit on the currently selected flow operation, but mostly they are …
- the source data of the operation, or in other words, the result(s) of the predecessor operation(s) (thus not for data sources, which have no predecessor)
- the result(s) of the operation, or in other words, the input data of the following operation(s) (thus not for data destinations, which have no predecessor)
- the result preview of the operation (also not for data destinations)
- further, arbitrarily selectable result data of other operations or the data of Data tables. These can be added by the “+”.
Since the possibilities of the Data Evaluation are quite extensive, a separate section of the documentation is dedicated to it.